
UDS2-73 SWP
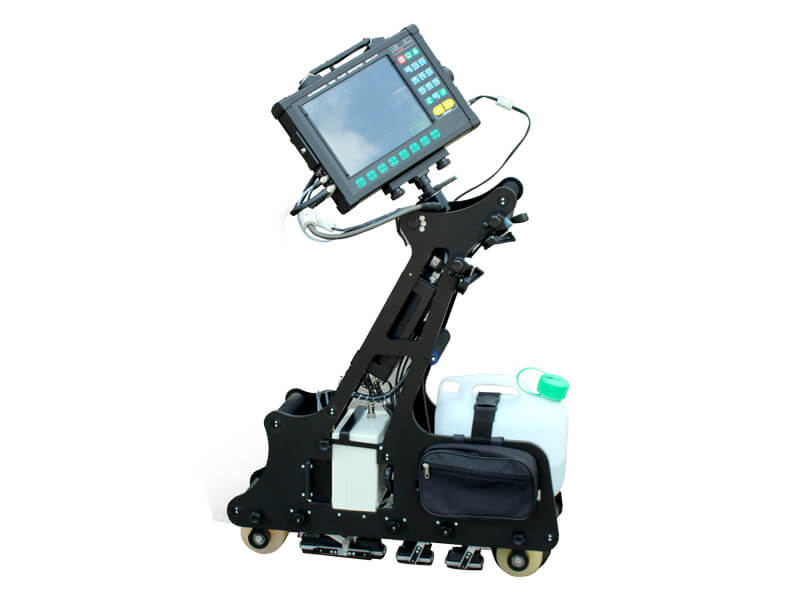
The UDS2-73 SWP ultrasonic rail flaw detector is intended for continuous, mechanized rail testing of railway tracks, including turnouts (crossings and frogs), at speeds of up to 5 km/h.
The UDS2-73 SWP ultrasonic rail flaw detector is intended for continuous, mechanized rail testing of railway tracks, including turnouts (crossings and frogs), at speeds of up to 5 km/h.

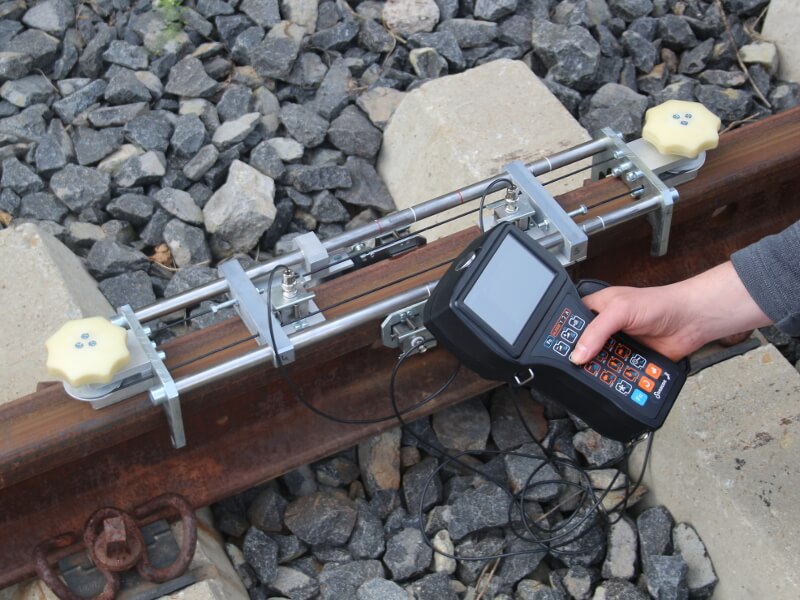
The OKOSCAN UT 73HS PICKUP is a high-speed ultrasonic (UT) rail testing System for railway tracks.

The flaw detector is intended for defects detection in both rails along the running surface and rail cross-section, except for the rail base blades using flaw detection trolley during complete testing, and for the confirmatory testing of separate rail cross-sections and welded joints by means of manual probes.
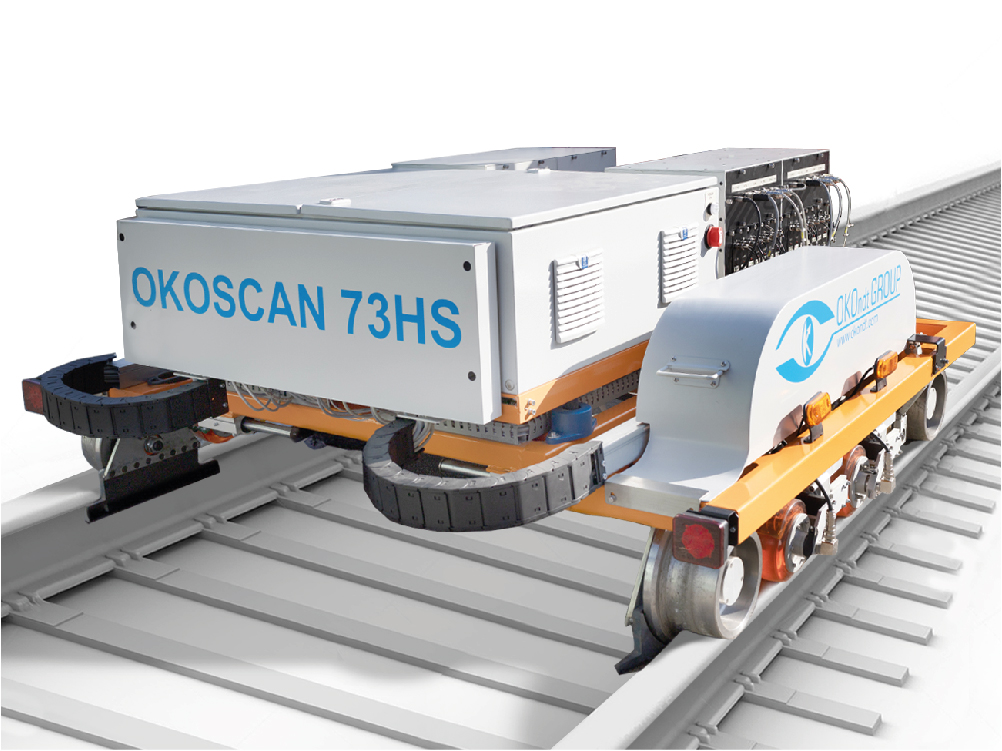
The OKOSCAN 73HS System is intended for automated high-speed testing of rails laid down in a track.

Ultrasonic dual-rail flaw detector UDS2-73 SL for ultrasonic inspection of standard profile rails and tram rails
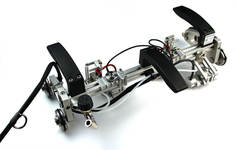
Ultrasonic single-rail flaw detector UDS2-77 SC is a manually driven cart designed for autonomous inspection of one streetcar line with rails of "groove" type and standard profile rails during .
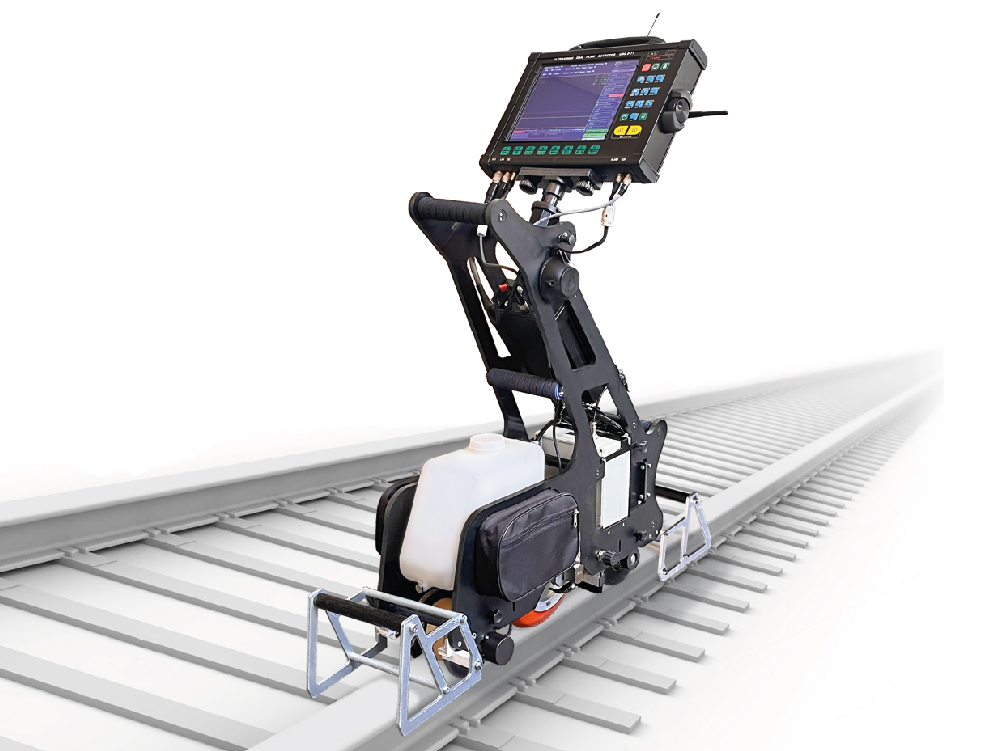
UDS2-77 ultrasonic single rail flaw detector is a mechanized trolley intended for the inspection of one rail line.
The flaw detector utilizes a unique scanning scheme that allows testing the entire rail section, except for foot flanges, by pulse echo, echo-shadow and echo-image techniques.
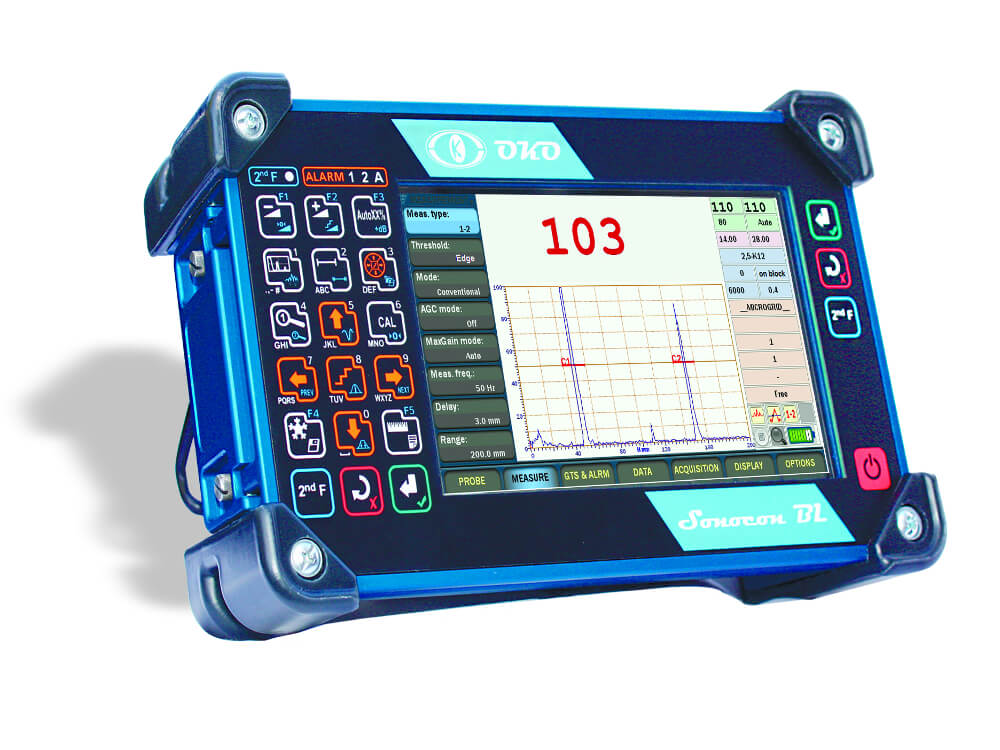
Sonocon BL belongs to the latest generation of portable UT instruments. Using a high-end electronics and having a richest set of modes and software features it can solve any task that can be sold with portable UT.
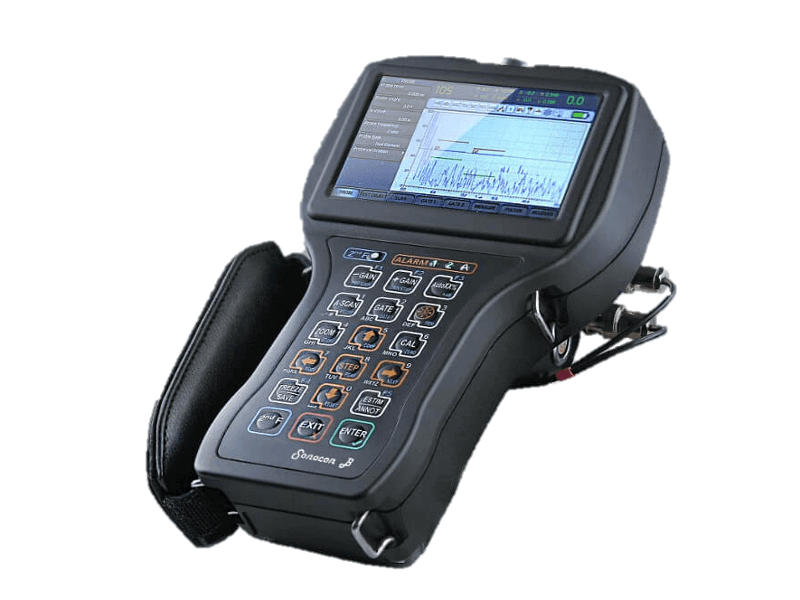
The Sonocon B belongs to the next generation of portable UT instruments. Using high-end electronics and having the richest set of modes and software features, it can solve any task that can be solved with a portable UT device.
USR-01 Set is intended for ultrasonic inspection of aluminothermic welded rail joints in accordance with EN14730-1 requirements. The USR-01 Set can be used for inspection of joints welded by the electrocontact method, for secondary rail track inspection based on the results of mechanized and quick systems of ultrasonic testing, as well as for pre-weld inspection of end sections of new and used rails before welding them at rail welding enterprises or in tracks.
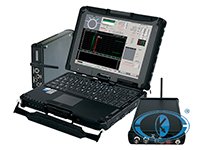
The ОКО-22М-UT ultrasonic flaw detector is a standalone electronic unit and is intended for application in high-performance automated multi-channel NDT Systems, transportable systems (mechanized NDT systems) or for manual testing.
Available in several flaw detector models that are different in number of channels and in a volume of built-in functions for results processing.
Over few decades TOFD method is widely used for fast and reliable UT of welded joints. TOFD offers great accuracy for measuring the critical size of crack-like-defects. The accuracy of better than ±1mm can be obtained in a wide range of material thickness.
Ultrasonic non-destructive testing technique for flaw detection is based on propagation and reflection of high-frequency (0.5 to 24 MHz) UT waves in a test object (steel, plastic, composites, rubber, etc.), with their further processing and visualizing on a special-purpose NDT instrument (flaw detector).
This method is used to search for material defects (pores, hairlines, inclusions, inhomogeneities, etc.) and to control workmanship quality like welding, soldering, etc. Ultrasound examination is a mandatory procedure for manufacturing and operation of numerous critical parts, such as aircraft motor parts, main pipelines or rails.
Basic UT techniques are as follows: